• Skip to main content
  • Skip to header right navigation
  • Skip to site footer
  • Blog
  • Free Resources
RevistaLab

RevistaLab

  • About
    • Meet Revista
    • Partners
    • Press
    • Sponsorship
    • Contact Us
  • Events
  • Why Subscribe?
    • Subscriptions
    • Business Development
    • Underwriting & Due Diligence
    • Development
    • Asset Management
    • Leasing
  • SUBSCRIBER LOGIN
Home / Leasing/Property Management / Investor Presence in Small Life Science Markets

Investor Presence in Small Life Science Markets

September 30, 2025 by Stephen Lindsey Topics: Construction/Development, Leasing/Property Management, Real Estate Financing/Capital Markets

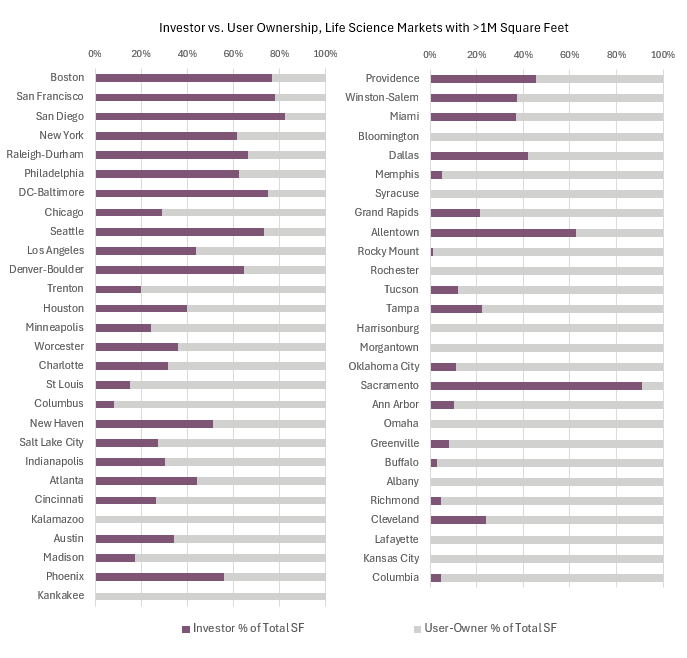
What does ownership look like in smaller life science markets? In the chart below we have simplified ownership into either investor or user-owned. The top three markets are dominated by investors, with around 80% of the square footage owned by private investors and REITs. Outside the top 3, many of the other large markets are still investor heavy, typically falling between 60-70% investor owned. Once we get out of the top 10, there is a lot more variation.

A common profile for smaller markets is a historically industrial city that now contains a manufacturing campus for pharmaceuticals, biotech, medical devices, etc. Some examples from the chart are Kalamazoo (Pfizer campus) and Syracuse (Lotte Biologics).   These two markets, as well as a handful of others, are completely owned by users, so there is zero investor presence. While this is common, there are some small life science markets that have gained investor attention like New Haven, Phoenix, Allentown, and Sacramento. These four markets have more than 50% investor ownership and fall into the size category of 1-3 million square feet. Three of the four, with Sacramento being the exception, have dodged the recent occupancy troubles found in the large, investor driven markets.

Stephen Lindsey
Stephen Lindsey

Other Articles by Stephen Lindsey:

    • 7.3M Square Feet Traded over the Last Year
    • Employment Trends in the Top Markets
    • Self-Developed Projects Still Breaking Ground

Previous Post:Life Science Construction Picks Up in 2Q

Sidebar

Topics

  • Construction/Development
  • Industry News
  • Leasing/Property Management
  • Mergers/Acquisitions
  • Policy/Legislation
  • Real Estate Financing/Capital Markets
  • Revista Best Practices
  • Revista News
  • Uncategorized

Recent Posts

  • Investor Presence in Small Life Science Markets
  • Life Science Construction Picks Up in 2Q
  • A Look at the Worcester, MA Life Science Real Estate Market
  • 7.3M Square Feet Traded over the Last Year
  • Newer Life Science Properties Driving Occupancy Losses Across the Sector

Archives

Other Free Resources

Life Science Real Estate Industry Professionals

Search for and/or list your life science real estate services in Revista’s life science real estate directory.

Reports & White Papers

Download free reports & white papers on life science real estate.

Archives

  • September 2025
  • August 2025
  • July 2025
  • June 2025
  • May 2025
  • April 2025
  • March 2025
  • February 2025
  • January 2025
  • December 2024
  • November 2024
  • October 2024
  • September 2024
  • August 2024
  • July 2024
  • June 2024
  • May 2024
  • April 2024
  • February 2024
  • November 2023
  • October 2023
  • August 2023
  • July 2023
  • June 2023
  • March 2023
  • October 2022
  • September 2022

Categories

  • Construction/Development
  • Industry News
  • Leasing/Property Management
  • Mergers/Acquisitions
  • Policy/Legislation
  • Real Estate Financing/Capital Markets
  • Revista Best Practices
  • Revista News
  • Uncategorized

Meta

  • Log in
  • Entries feed
  • Comments feed
  • WordPress.org

Ready to Schedule a Demo?

Get in Touch Now
  • Why Subscribe?
  • Events
  • The LAB Report
  • Add A Life Science Directory Listing
  • Contact Us
  • Sponsorship
  • About
  • Terms of Use
  • Press

SIGN UP FOR LAB REPORT NEWSLETTER

  • Twitter
  • Facebook
  • LinkedIn