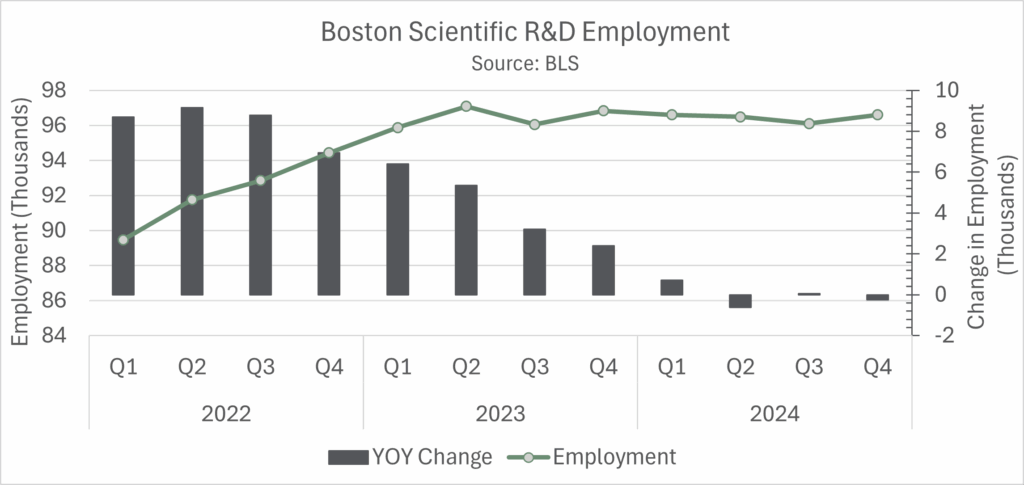
How have the core life science clusters held up with regards to life science employment? Employment is an important indicator of an industry’s health and gives a look into how the sector is handling the economic circumstances. The chart below shows the total scientific research and development employment and it’s YOY change for the greater Boston metro area. 2022 was a year of high growth, represented by the climbing total (green line) and YOY growth hovering around 8,000 jobs. Since then, growth has flattened out, and 2024 was characterized by alternating quarters of slightly positive and slightly negative employment changes. Relative to the other core clusters, Boston has held strong. San Francisco showed consistent decreases in 2024, starting with 70,318 and ending with 68,646. San Diego fared the worst and has shown consistent employment decline from the middle of 2023 to the end of 2024.