• Skip to main content
  • Skip to header right navigation
  • Skip to site footer
  • Blog
  • Free Resources
RevistaLab

RevistaLab

  • About
    • Meet Revista
    • Partners
    • Press
    • Sponsorship
    • Contact Us
  • Events
  • Why Subscribe?
    • Subscriptions
    • Business Development
    • Underwriting & Due Diligence
    • Development
    • Asset Management
    • Leasing
  • SUBSCRIBER LOGIN
Home / Construction/Development / Life Science Construction Update 2Q24

Life Science Construction Update 2Q24

July 17, 2024 by Stephen Lindsey Topics: Construction/Development, Real Estate Financing/Capital Markets

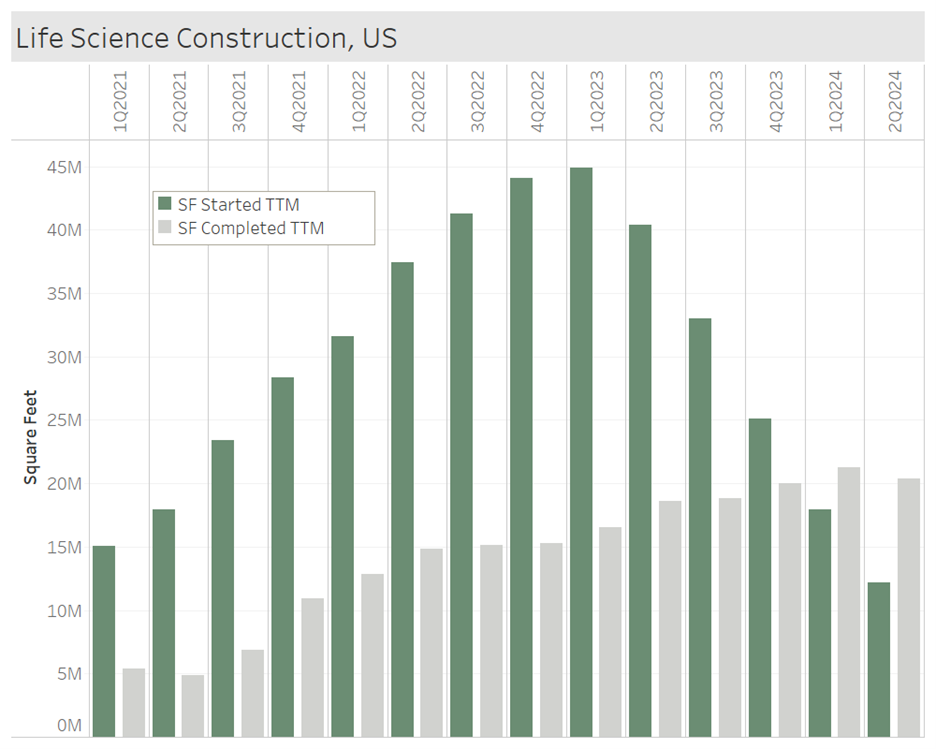
The 2Q24 construction numbers show a continuation of the decline in new projects. The chart below shows the square footage of projects starting and completing construction on an annual basis. 12.2 million square feet have started construction in the past year, and 20.3 million have been completed. Beginning last quarter, the level of completions outpaced the level of starts. The gap between these two measures has more than doubled in size and it is likely that a large gap will be maintained in the near future. As a result of the spike of new projects in 2022, the construction pipeline is still inflated, with 63.5 million square feet in progress. As long as projects continue to move forward, the completion numbers will remain high. SF Started will likely remain low for two reasons. Firstly, interest rates and construction costs are still high, which makes it tough to finance developments. Second, even if we get rate cuts in September, the interest in developing new space will be suppressed until a lot of the new space is absorbed. Recently, the level of absorption has not been able to match all the new supply coming onto the market. Until this relationship reverses, there won’t be strong incentives to start building more space.

Stephen Lindsey
Stephen Lindsey

Other Articles by Stephen Lindsey:

    • Manufacturing: A Healthier Subsection of Life Science Real Estate
    • First Look at 1Q25 Life Science Transaction Activity
    • Absorption Across the Top 20 Life Science Markets

Previous Post:Ownership Composition: Top Markets vs. the Rest of the US
Next Post:Occupancy Rate Declining in Top Biotech Markets

Sidebar

Topics

  • Construction/Development
  • Industry News
  • Leasing/Property Management
  • Mergers/Acquisitions
  • Policy/Legislation
  • Real Estate Financing/Capital Markets
  • Revista News
  • Uncategorized

Recent Posts

  • Manufacturing: A Healthier Subsection of Life Science Real Estate
  • New Deliveries, Older Properties Most Impacted by Oversupply
  • First Look at 1Q25 Life Science Transaction Activity
  • Life Science Deliveries Stall in 1Q, Pipeline Still Significant
  • Absorption Across the Top 20 Life Science Markets

Archives

Other Free Resources

Life Science Real Estate Industry Professionals

Search for and/or list your life science real estate services in Revista’s life science real estate directory.

Reports & White Papers

Download free reports & white papers on life science real estate.

Archives

  • May 2025
  • April 2025
  • March 2025
  • February 2025
  • January 2025
  • December 2024
  • November 2024
  • October 2024
  • September 2024
  • August 2024
  • July 2024
  • June 2024
  • May 2024
  • April 2024
  • February 2024
  • November 2023
  • October 2023
  • August 2023
  • July 2023
  • June 2023
  • March 2023
  • October 2022
  • September 2022

Categories

  • Construction/Development
  • Industry News
  • Leasing/Property Management
  • Mergers/Acquisitions
  • Policy/Legislation
  • Real Estate Financing/Capital Markets
  • Revista News
  • Uncategorized

Meta

  • Log in
  • Entries feed
  • Comments feed
  • WordPress.org

Ready to Schedule a Demo?

Get in Touch Now
  • Why Subscribe?
  • Events
  • The LAB Report
  • Add A Life Science Directory Listing
  • Contact Us
  • Sponsorship
  • About
  • Terms of Use
  • Press

SIGN UP FOR LAB REPORT NEWSLETTER

  • Twitter
  • Facebook
  • LinkedIn