• Skip to main content
  • Skip to header right navigation
  • Skip to site footer
  • Blog
  • Free Resources
RevistaLab

RevistaLab

  • About
    • Meet Revista
    • Partners
    • Press
    • Sponsorship
    • Contact Us
  • Events
  • Why Subscribe?
    • Subscriptions
    • Business Development
    • Underwriting & Due Diligence
    • Development
    • Asset Management
    • Leasing
  • SUBSCRIBER LOGIN
Home / Construction/Development / Life Science Growth by State

Life Science Growth by State

February 24, 2025 by Stephen Lindsey Topics: Construction/Development, Industry News, Leasing/Property Management

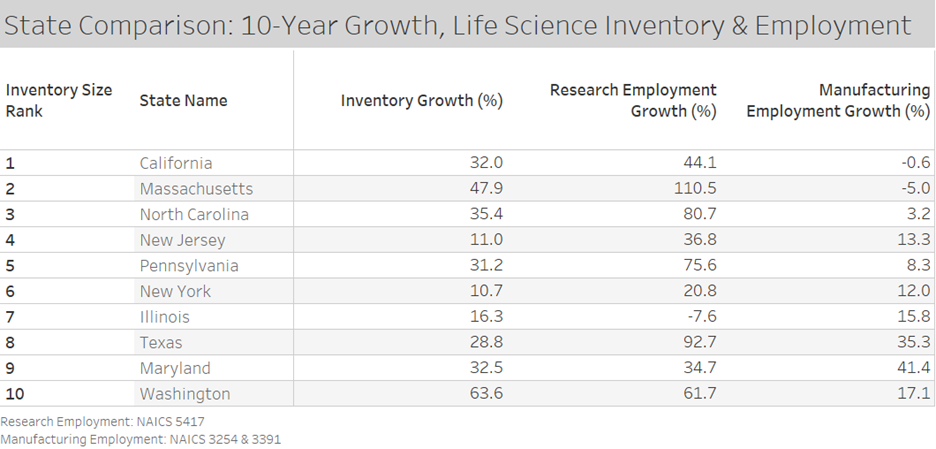
How much has the life science real estate sector grown over the past decade? In the table below we are looking at growth from 2014-2024 for life science inventory & employment. The inventory growth is for all life science properties, including manufacturing. Research employment growth is for R&D in life science, engineering and the physical sciences. Manufacturing employment includes pharmaceutical & medical equipment manufacturing. We are showing these stats for the ten states with the most life science real estate.

Interestingly, the only two states on the list with negative growth in manufacturing are California and Massachusetts. They are both clearly strong when it comes to growth in research activity, but it seems that primarily the smaller markets in other states are increasing on both the research and manufacturing side. Behind Massachusetts’ research employment growth of 110%, Texas takes an impressive second with 92%. Maryland had the highest for manufacturing employment growth and surprisingly Washington State had the highest inventory growth. The life science inventory in Washington is essentially the Seattle metro, which has grown from a little over 5 million square feet in 2014, to over 8 million in 2024.

Stephen Lindsey
Stephen Lindsey

Other Articles by Stephen Lindsey:

    • Manufacturing: A Healthier Subsection of Life Science Real Estate
    • First Look at 1Q25 Life Science Transaction Activity
    • Absorption Across the Top 20 Life Science Markets

Previous Post:Life Science Real Estate Transaction Update
Next Post:Established Micro Clusters More Insulated from Market Cycles

Sidebar

Topics

  • Construction/Development
  • Industry News
  • Leasing/Property Management
  • Mergers/Acquisitions
  • Policy/Legislation
  • Real Estate Financing/Capital Markets
  • Revista News
  • Uncategorized

Recent Posts

  • Manufacturing: A Healthier Subsection of Life Science Real Estate
  • New Deliveries, Older Properties Most Impacted by Oversupply
  • First Look at 1Q25 Life Science Transaction Activity
  • Life Science Deliveries Stall in 1Q, Pipeline Still Significant
  • Absorption Across the Top 20 Life Science Markets

Archives

Other Free Resources

Life Science Real Estate Industry Professionals

Search for and/or list your life science real estate services in Revista’s life science real estate directory.

Reports & White Papers

Download free reports & white papers on life science real estate.

Archives

  • May 2025
  • April 2025
  • March 2025
  • February 2025
  • January 2025
  • December 2024
  • November 2024
  • October 2024
  • September 2024
  • August 2024
  • July 2024
  • June 2024
  • May 2024
  • April 2024
  • February 2024
  • November 2023
  • October 2023
  • August 2023
  • July 2023
  • June 2023
  • March 2023
  • October 2022
  • September 2022

Categories

  • Construction/Development
  • Industry News
  • Leasing/Property Management
  • Mergers/Acquisitions
  • Policy/Legislation
  • Real Estate Financing/Capital Markets
  • Revista News
  • Uncategorized

Meta

  • Log in
  • Entries feed
  • Comments feed
  • WordPress.org

Ready to Schedule a Demo?

Get in Touch Now
  • Why Subscribe?
  • Events
  • The LAB Report
  • Add A Life Science Directory Listing
  • Contact Us
  • Sponsorship
  • About
  • Terms of Use
  • Press

SIGN UP FOR LAB REPORT NEWSLETTER

  • Twitter
  • Facebook
  • LinkedIn