• Skip to main content
  • Skip to header right navigation
  • Skip to site footer
  • Blog
  • Free Resources
RevistaLab

RevistaLab

  • About
    • Meet Revista
    • Partners
    • Press
    • Sponsorship
    • Contact Us
  • Events
  • Why Subscribe?
    • Subscriptions
    • Business Development
    • Underwriting & Due Diligence
    • Development
    • Asset Management
    • Leasing
  • SUBSCRIBER LOGIN
Home / Policy/Legislation / Life Science Transaction Activity: What is the Data Showing for 3Q?

Life Science Transaction Activity: What is the Data Showing for 3Q?

October 17, 2024 by Stephen Lindsey Topics: Industry News, Policy/Legislation, Real Estate Financing/Capital Markets

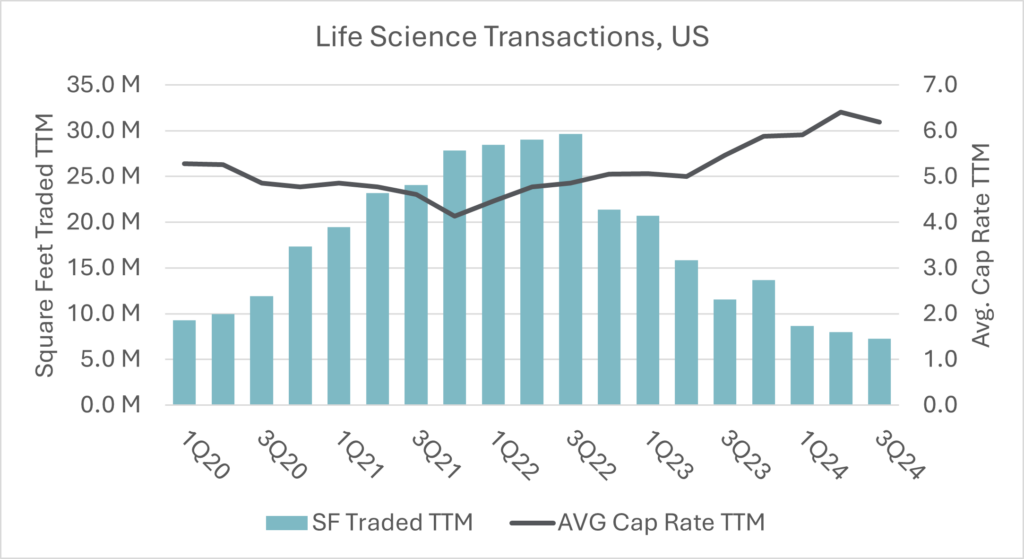
The first half of 2024 was slow going for life science property sales. About 1.5 million square feet traded hands, and the previous trend of declining activity continued. With rate cuts from this from this past September, are there any signs of a pivot? The chart below includes our preliminary data for 3Q and the trailing twelve-month square footage numbers show a slight decrease from the previous quarter (8 million vs 7.3 million). While the square feet numbers are showing a slight decrease, the volume in dollars shows a slight increase this quarter, with $4.5 billion over the past year. Cap Rates did decrease this quarter, coming down around 20 basis points to an average of 6.2. Overall, there is no significant change in activity, but that is expected, as the rate cuts only took effect in the last 2 weeks of the quarter. This primes 4Q as potential pivot point. With more potential rate cuts in November, as well as a presidential election, the next couple of months will be a busy period for the American economy, so make sure to keep tabs on the latest real estate trends.

Stephen Lindsey
Stephen Lindsey

Other Articles by Stephen Lindsey:

    • Manufacturing: A Healthier Subsection of Life Science Real Estate
    • First Look at 1Q25 Life Science Transaction Activity
    • Absorption Across the Top 20 Life Science Markets

Previous Post:R&D Employment Projection
Next Post:Life Science Cluster Performance Varies Widely

Sidebar

Topics

  • Construction/Development
  • Industry News
  • Leasing/Property Management
  • Mergers/Acquisitions
  • Policy/Legislation
  • Real Estate Financing/Capital Markets
  • Revista News
  • Uncategorized

Recent Posts

  • Manufacturing: A Healthier Subsection of Life Science Real Estate
  • New Deliveries, Older Properties Most Impacted by Oversupply
  • First Look at 1Q25 Life Science Transaction Activity
  • Life Science Deliveries Stall in 1Q, Pipeline Still Significant
  • Absorption Across the Top 20 Life Science Markets

Archives

Other Free Resources

Life Science Real Estate Industry Professionals

Search for and/or list your life science real estate services in Revista’s life science real estate directory.

Reports & White Papers

Download free reports & white papers on life science real estate.

Archives

  • May 2025
  • April 2025
  • March 2025
  • February 2025
  • January 2025
  • December 2024
  • November 2024
  • October 2024
  • September 2024
  • August 2024
  • July 2024
  • June 2024
  • May 2024
  • April 2024
  • February 2024
  • November 2023
  • October 2023
  • August 2023
  • July 2023
  • June 2023
  • March 2023
  • October 2022
  • September 2022

Categories

  • Construction/Development
  • Industry News
  • Leasing/Property Management
  • Mergers/Acquisitions
  • Policy/Legislation
  • Real Estate Financing/Capital Markets
  • Revista News
  • Uncategorized

Meta

  • Log in
  • Entries feed
  • Comments feed
  • WordPress.org

Ready to Schedule a Demo?

Get in Touch Now
  • Why Subscribe?
  • Events
  • The LAB Report
  • Add A Life Science Directory Listing
  • Contact Us
  • Sponsorship
  • About
  • Terms of Use
  • Press

SIGN UP FOR LAB REPORT NEWSLETTER

  • Twitter
  • Facebook
  • LinkedIn