• Skip to main content
  • Skip to header right navigation
  • Skip to site footer
  • Blog
  • Free Resources
RevistaLab

RevistaLab

  • About
    • Meet Revista
    • Partners
    • Press
    • Sponsorship
    • Contact Us
  • Events
  • Why Subscribe?
    • Subscriptions
    • Business Development
    • Underwriting & Due Diligence
    • Development
    • Asset Management
    • Leasing
  • SUBSCRIBER LOGIN
Home / Industry News / Supply Growth Pressuring Occupancy in the Boston CBSA

Supply Growth Pressuring Occupancy in the Boston CBSA

February 8, 2024 by Mike Hargrave Topics: Construction/Development, Industry News, Leasing/Property Management, Revista News

It is no secret that inventory has been increasing lately in many life science real estate markets.  Developers have been responding to increasing demand for new space during the past years, especially coming out of the COVID-19 pandemic era. The Boston CBSA has been ground zero for much of this increased supply activity.  The graph below shows the current occupancy rate in the greater Boston CBSA along with quarterly completions and absorption of vacant space in the market.  It says about 8 million square feet (SF) of lab space has been delivered to the market during the past 6 quarters.  During this period, absorption has been strong at just over 6 million SF of lab space, but underneath the level of completions.  As a result, the occupancy rate has fallen from 94.4% to 92.1% during this time period.

Note that this data includes both traditional wet lab buildings and GMP or manufacturing buildings.  In addition, www.Revistalab.com maintains this data for submarkets in the top 3 CBSAs as well as trend information on secondary lab metros.  For more information, please contact Hilda Martin.

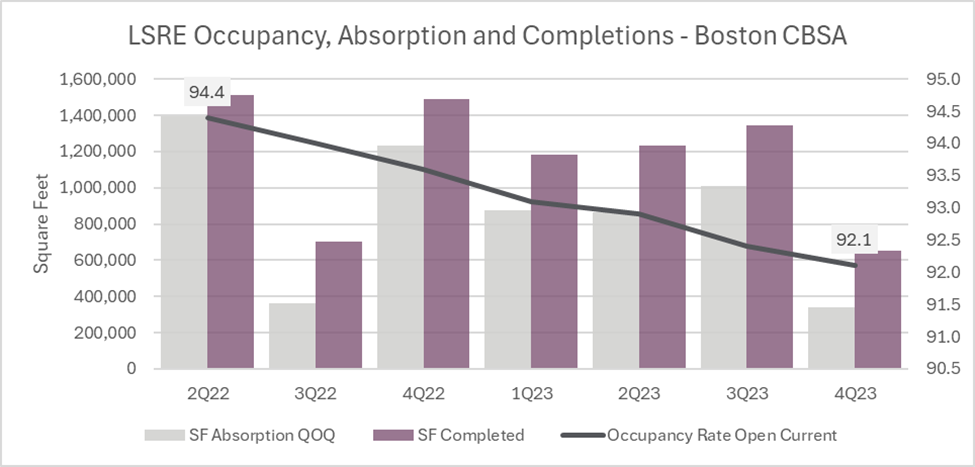
Data Source: www.Revistalab.com

Mike Hargrave
Mike Hargrave

Other Articles by Mike Hargrave:

    • Life Science Real Estate Transaction Update
    • Life Science Real Estate Fundamentals Showing Signs of Stabilizing
    • LSRE – Demand is Growing but not as fast as Supply

Previous Post:Life Science Real Estate Transaction Volume Picks up in 4Q23
Next Post:4th Quarter Life Science Real Estate Update – Slides and Webinar

Sidebar

Topics

  • Construction/Development
  • Industry News
  • Leasing/Property Management
  • Mergers/Acquisitions
  • Policy/Legislation
  • Real Estate Financing/Capital Markets
  • Revista News
  • Uncategorized

Recent Posts

  • Manufacturing: A Healthier Subsection of Life Science Real Estate
  • New Deliveries, Older Properties Most Impacted by Oversupply
  • First Look at 1Q25 Life Science Transaction Activity
  • Life Science Deliveries Stall in 1Q, Pipeline Still Significant
  • Absorption Across the Top 20 Life Science Markets

Archives

Other Free Resources

Life Science Real Estate Industry Professionals

Search for and/or list your life science real estate services in Revista’s life science real estate directory.

Reports & White Papers

Download free reports & white papers on life science real estate.

Archives

  • May 2025
  • April 2025
  • March 2025
  • February 2025
  • January 2025
  • December 2024
  • November 2024
  • October 2024
  • September 2024
  • August 2024
  • July 2024
  • June 2024
  • May 2024
  • April 2024
  • February 2024
  • November 2023
  • October 2023
  • August 2023
  • July 2023
  • June 2023
  • March 2023
  • October 2022
  • September 2022

Categories

  • Construction/Development
  • Industry News
  • Leasing/Property Management
  • Mergers/Acquisitions
  • Policy/Legislation
  • Real Estate Financing/Capital Markets
  • Revista News
  • Uncategorized

Meta

  • Log in
  • Entries feed
  • Comments feed
  • WordPress.org

Ready to Schedule a Demo?

Get in Touch Now
  • Why Subscribe?
  • Events
  • The LAB Report
  • Add A Life Science Directory Listing
  • Contact Us
  • Sponsorship
  • About
  • Terms of Use
  • Press

SIGN UP FOR LAB REPORT NEWSLETTER

  • Twitter
  • Facebook
  • LinkedIn